Today, many businesses collect a lot of data. They use dashboards, reports, KPIs, and charts. But even with all this data, leaders often feel confused. They may ask:
-
Are we doing well as a company?
-
Which area needs attention right now?
-
Are our teams working toward the same goals?
-
What should we fix first?
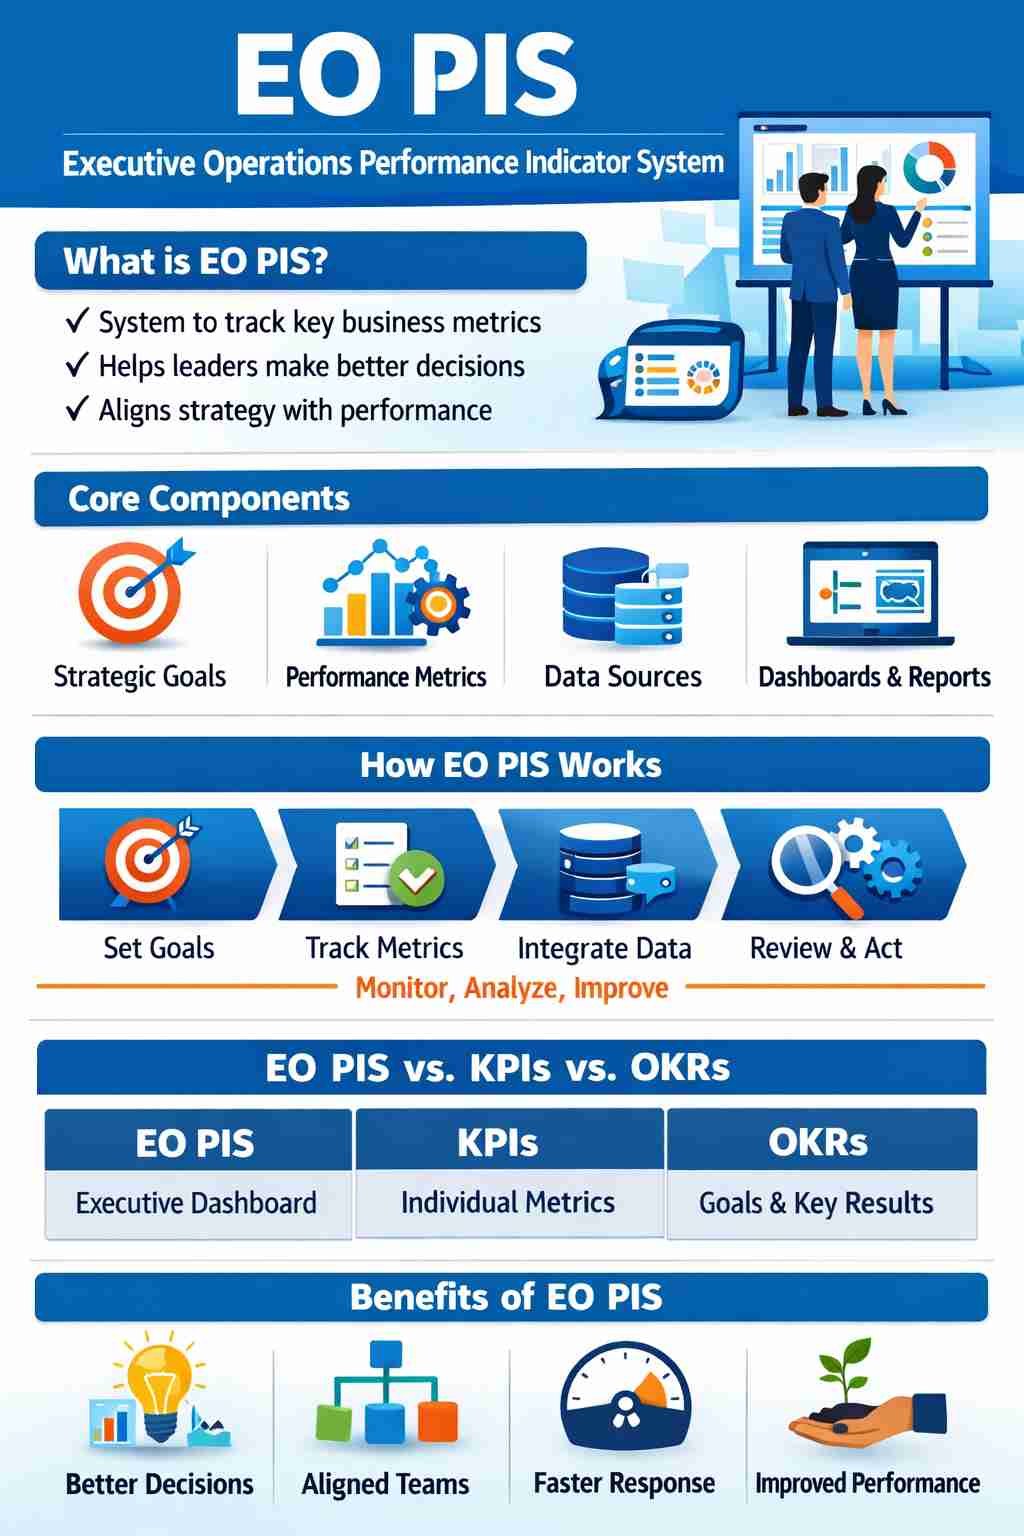
This is where EO PIS helps. EO PIS means Executive Operations Performance Indicator System. It is a simple system that helps leaders see how the business is doing and make better decisions.
This guide explains EO PIS in simple words. You will learn what EO PIS is, why it is useful, how it works, and how to use it in your business.
What Is EO PIS?
EO PIS stands for Executive Operations Performance Indicator System.
It is a way for leaders to:
-
See the most important business numbers in one place
-
Understand what is going well and what is not
-
Make better and faster decisions
-
Keep teams focused on the same goals
What EO PIS Is
-
A system to track important performance numbers
-
A tool for leaders and managers
-
A way to connect goals with results
What EO PIS Is NOT
-
❌ Not just one KPI
-
❌ Not a normal report
-
❌ Not only for one team
-
❌ Not only for finance
Why EO PIS Is Important
Many companies face the same problems:
Common Problems
-
Too many reports and dashboards
-
Different numbers from different teams
-
Slow monthly reports
-
Leaders cannot see problems early
-
Teams work on different goals
How EO PIS Helps
-
Brings key numbers into one view
-
Makes reports clear and simple
-
Helps leaders see problems early
-
Keeps teams working toward the same goals
-
Saves time on manual reporting
Main Parts of EO PIS
EO PIS works as a system with different parts.
EO PIS Main Parts Table
| Part | What It Does |
|---|---|
| Business Goals | Shows what the company wants to achieve |
| Performance Numbers | Shows how well the company is doing |
| Data Sources | Where the numbers come from |
| Dashboards & Reports | Shows numbers in a simple way |
| Owners & Rules | Makes sure numbers are correct and used |
How EO PIS Works (Step by Step)
Step 1: Set Clear Business Goals
First, leaders decide what is most important.
Examples:
-
Grow sales
-
Keep customers happy
-
Reduce costs
-
Improve service quality
Read also: Costco Rival Launches Megastore
Step 2: Choose Simple Performance Numbers
Each goal needs clear numbers.
| Business Goal | Example Numbers |
|---|---|
| Grow Sales | Monthly sales, new customers |
| Customer Happiness | Customer score, repeat buyers |
| Reduce Costs | Cost per order, waste rate |
| Service Quality | On-time delivery, error rate |
Step 3: Collect Data from Systems
Numbers can come from:
-
Sales system
-
Finance system
-
Customer support tools
-
Operations systems
Step 4: Show Data on Dashboards
Dashboards should:
-
Be easy to read
-
Show trends over time
-
Highlight problems
-
Use simple charts
Step 5: Review Numbers Often
Leaders should check EO PIS:
-
Weekly
-
Monthly
-
In leadership meetings
Step 6: Take Action and Improve
After reviewing the numbers, leaders:
-
Fix problems
-
Support teams
-
Change goals if needed
-
Improve the system over time
EO PIS vs KPI vs OKR (Simple Comparison)
These terms can be confusing. Here is a simple table:
| Term | What It Means | Used By |
|---|---|---|
| KPI | A number to measure performance | Teams and managers |
| OKR | Goals and results to achieve them | Teams and leaders |
| EO PIS | A system that shows key numbers for leaders | Executive team |
Simple idea:
-
KPIs = numbers
-
OKRs = goals
-
EO PIS = system that shows important numbers to leaders
Benefits of EO PIS
Using EO PIS brings many benefits.
Main Benefits
-
Leaders see the full business picture
-
Faster and better decisions
-
Less confusion about numbers
-
Teams work toward the same goals
-
Problems are found early
-
Less time spent on reports
Where EO PIS Is Used
EO PIS can be used in many areas of a business.
Common Use Cases
-
Company leadership dashboards
-
Sales and growth tracking
-
Operations and delivery tracking
-
Financial performance tracking
-
Digital project tracking
Example EO PIS Dashboard Sections
| Section | Example Numbers |
|---|---|
| Finance | Revenue, profit, cash flow |
| Customers | Customer score, churn rate |
| Operations | Delivery time, error rate |
| People | Staff turnover, engagement score |
| Risk | Complaints, system downtime |
Common Problems When Using EO PIS
EO PIS can fail if not used well.
Common Mistakes
-
❌ Too many numbers on one screen
-
❌ Numbers are not correct
-
❌ No one owns the numbers
-
❌ Dashboards are hard to understand
-
❌ Leaders do not use the system
How to Avoid These Problems
-
Use only the most important numbers
-
Check data quality often
-
Give each number an owner
-
Keep dashboards simple
-
Use EO PIS in real meetings
Best Practices for EO PIS
Simple Best Practices List
-
Keep numbers easy to understand
-
Link every number to a business goal
-
Review numbers regularly
-
Ask teams to explain changes
-
Update the system as the business grows
-
Train leaders to use the dashboards
Tools for EO PIS
You can use simple tools to build EO PIS.
Common Tools
| Tool Type | Examples |
|---|---|
| Dashboards | Power BI, Tableau, Looker |
| Data Tools | Data connectors, ETL tools |
| Business Systems | ERP, CRM, support tools |
| Automation | Workflow and alert tools |
The Future of EO PIS
EO PIS is getting better with new technology.
Future Trends
-
More real-time data
-
Simple AI insights for leaders
-
Alerts when numbers change
-
Easy mobile dashboards
-
Better predictions for planning
Conclusion
EO PIS is a simple but powerful way for leaders to understand how their business is performing. It brings the most important numbers into one place and helps leaders make better decisions.
When EO PIS is used well, businesses can:
-
Work toward clear goals
-
Find problems early
-
Improve teamwork
-
Grow in a healthy and controlled way
EO PIS is not about having more data.
It is about having the right data in a simple system that leaders can use every day.